Foundation Repair Cost by State: 2026 Planning Data
Foundation repair cost by state is a planning estimate, not an official quote database. The estimate depends on local labor, soil movement, foundation type, access and repair method. Small crack, drainage or slab-lifting work often stays in the low-thousand-dollar range. Structural repairs with wall bracing, push piers, helical piers, underpinning, engineering or difficult access can reach $20,000–$60,000+.
Start with the state range, then match the visible problem and repair method. The tables and charts below explain where each estimate comes from and how to use it for quote screening.
How to Use This Cost Page
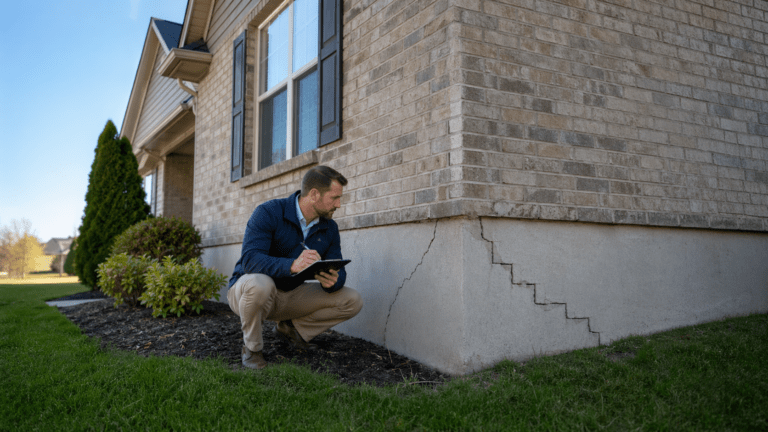
Start with your state range, then look at the problem you are seeing. A small stable crack is usually a different price conversation than foundation cracks that leak, widen or appear with movement. Sinking corners often point to foundation settlement. Uneven concrete may fall under slab foundation repair. Sagging floors usually point to crawl-space support, beam or pier issues. The estimator below helps you check the likely method and price band before you review a contractor quote.
State and Repair Method Estimator
The estimator combines the selected state baseline with repair method, scope and access difficulty. The state factor now uses 2025 BLS wage context [2], 2024 BEA Regional Price Parities [22], Census/NAHB permit demand [5], [7], soil and shrink-swell risk [8], [10], frost risk from NOAA/NCEI [25], and technical repair boundaries from IRC, HUD, FEMA, ICC-ES and ACI [13], [14], [17], [18], [19], [20].
Model Calibration
The model does not treat every state as a simple national-average multiplier. It blends cost pressure and technical risk. Labor and local price level carry the highest weight because foundation repair is labour-intensive. Soil, frost, access and foundation type adjust the range because they affect method choice and repair complexity.
| Model input | Weight | Data basis |
|---|---|---|
| State labor factor | 40% | BLS May 2025 OEWS and O*NET construction labor wage context [2], [3] |
| Regional price level | 20% | BEA 2024 Regional Price Parities by state [22] |
| Construction demand pressure | 15% | Census and NAHB residential permit activity [5], [7] |
| Soil and foundation risk | 15% | USGS swelling clays, NRCS soil hazards and foundation guidance [8], [10], [13] |
| Climate, access and repair complexity | 10% | NOAA frost index context, FEMA seismic/flood guidance, ICC-ES helical pile criteria and ACI repair guidance [25], [15], [16], [17], [18], [19], [20], [21] |
Foundation Repair Cost Patterns
The regional bars use the typical value assigned to each state in the CED dataset. The weights reflect labor, access, construction activity, frost, moisture, foundation type and soil-movement risk. Soil-risk inputs are supported by USGS and NRCS references [8], [10].
Typical cost by region
What the pattern means
Higher-cost states usually combine expensive labor, difficult access, basements, hillside sites, frost, seismic context, flood exposure or expansive soil risk. Lower-cost states can still produce high quotes when the repair includes several piers, wall anchors, drainage work, engineering, permits and restoration.
Estimated Repair Method Model by State
No public source gives exact state-by-state method shares for residential foundation repair. This chart estimates likely method mix from soil movement, moisture, frost, slab/basement/crawl-space patterns, seismic or hillside context and access difficulty. Use it as a repair tendency model, not measured market-share data.
Estimated repair-method mix for the selected state.
Cost Range by Repair Method
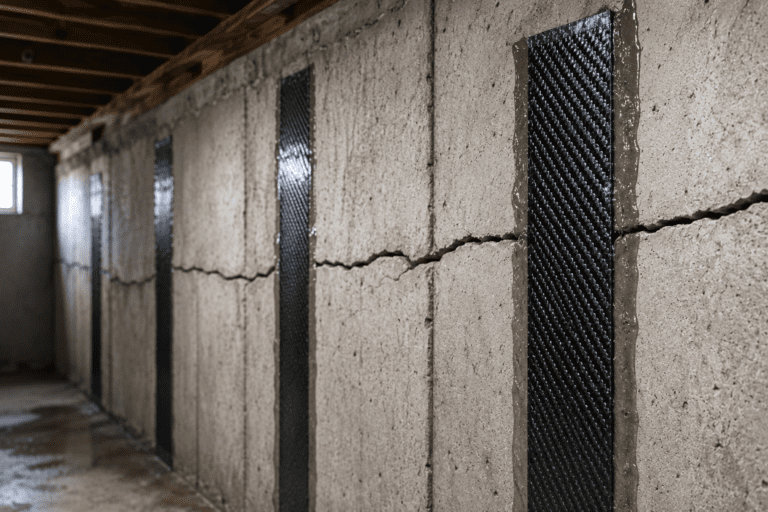
The bars use typical method costs from the repair-method table. Wall systems such as carbon fiber straps sit in a different cost band than crack sealing, drainage work or deep foundation systems. Labor data comes from BLS/O*NET [1], [2]; technical boundaries come from ICC-ES, ACI, HUD and FEMA references [18], [19], [14], [16].
Searchable 50-State Dataset
The state table is a modelled CED dataset. It combines a national repair baseline with state adjustments for labor, construction demand, soil movement, frost, moisture, seismic/flood context, access and contractor-market density. Use it to screen quotes before local inspection, engineering review, permits and warranty terms.
| State | Region | Range | Typical | Evidence | Main cost driver | Contractor note |
|---|
Repair Method Data
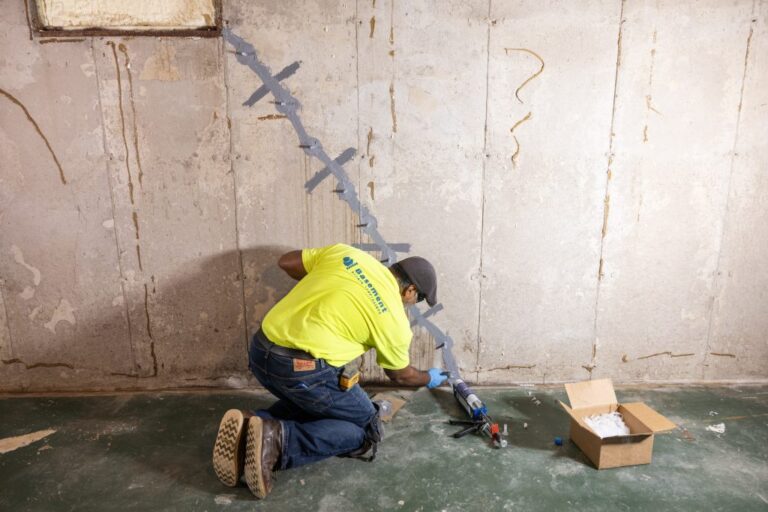
The same crack can produce different quotes depending on whether the cause is water, settlement, wall pressure, soil heave or structural movement. The ranges below are planning ranges tied to typical repair scope and labor intensity.
| Repair method | Planning range | Typical | Works best for | Avoid when | Lead value |
|---|---|---|---|---|---|
| Drainage correction / grading / waterproofing | $1,500–$9,000 | $4,200 | Poor grading, downspout discharge, wet crawl spaces, hydrostatic pressure and basement water | Deep settlement without structural stabilisation | Medium |
| Crack sealing / epoxy injection | $500–$2,500 | $1,200 | Narrow, stable cracks and water-entry sealing | Active settlement, rotation, bowing walls or structural displacement | Low |
| Wall anchors / carbon straps / steel beams | $4,000–$18,000 | $9,500 | Bowed or cracked basement walls with lateral earth pressure | Walls that have sheared, collapsed, or need full reconstruction | High |
| Slab lifting / foam or mudjacking | $1,200–$7,000 | $3,500 | Sunken slabs with voids below non-structural or lightly loaded areas | Ongoing washout, heave, severe cracking or wall rotation | Medium |
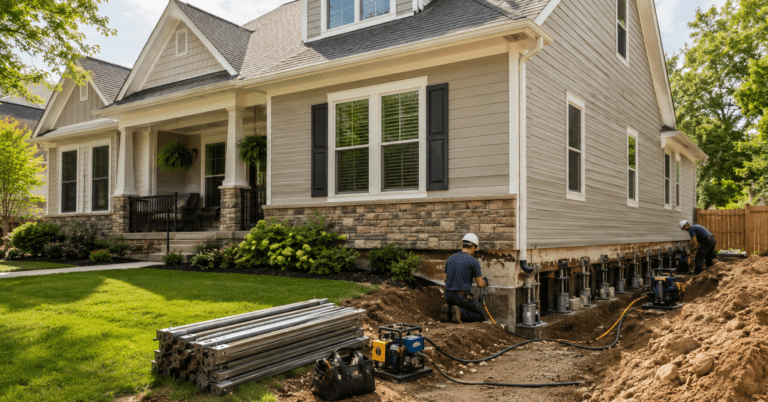
| Push piers / resistance piers | $8,000–$32,000 | $17,500 | Settlement where structure load can drive piers to competent bearing | Light structures without enough reaction load or poor access | High |
| Helical piers / helical piles | $9,000–$36,000 | $19,000 | Settlement, additions, lighter structures, known torque criteria and tight access | Wrong soil profile, corrosion exposure or no load verification | High |
| Crawl-space support posts / beam repair | $2,500–$15,000 | $7,000 | Sagging floors, beam/girder support issues and crawl-space settlement | Major exterior foundation settlement without separate stabilisation | Medium |
| Major underpinning / engineered structural repair | $18,000–$65,000 | $36,000 | Severe settlement, many piers, engineering, permits and structural restoration | No soil investigation or vague contractor-only diagnosis on severe movement | Very high |
Cost by Foundation Type
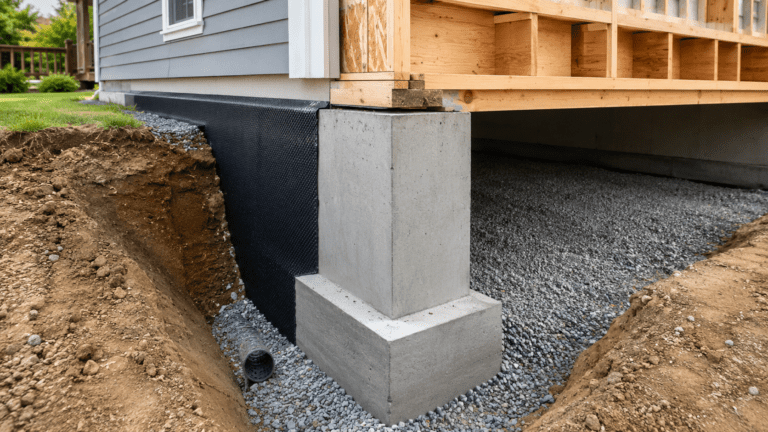
Foundation type changes repair cost because access, load path and moisture exposure change the repair. A pier and beam floor, a basement wall and a footing and stem wall foundation do not fail or repair in the same way.
| Foundation type | Common problems | Typical repair types | Cost sensitivity | Why it matters |
|---|---|---|---|---|
| Slab-on-grade | Settlement, heave, shrinkage cracks, plumbing leaks | Slab lifting, piers, drainage, moisture control | Medium to high | Very sensitive in expansive clay and drought cycles |
| Basement | Bowed walls, stair-step cracks, water pressure, settlement | Wall anchors, steel beams, carbon straps, waterproofing, piers | High | Water and lateral soil pressure can make repair scope grow fast |
| Crawl space | Sagging floors, moisture, weak posts, beam damage, settlement | Support posts, beam repair, drainage, encapsulation, piers | Medium to high | Access and moisture control affect labor cost |
| Pier and beam | Rot, weak supports, differential movement, poor drainage | Shimming, posts, beams, pier repair, moisture control | Medium | Often repairable in phases, but rot and access change cost |
| Hillside / stepped foundation | Slope movement, retaining pressure, drainage, seismic demand | Engineering, drainage, anchors, piers, underpinning | High to very high | Engineer review is often worth it before bidding |
Quote Red Flags
These checks help separate a clear scope from a vague quote. They also help homeowners plan cost, disruption and living through the repair before signing.
Homeowner red flags
- The quote does not name the repair method.
- Pier count, anchor spacing or beam size is missing.
- Drainage is excluded even though water caused the damage.
- The warranty sounds broad but excludes soil movement.
- The contractor recommends piers for every crack without explaining movement.
Contractor scope notes
- List exclusions for landscaping, slab patching, permits, engineering and utilities.
- Separate stabilization, lifting, drainage, waterproofing and cosmetic repair.
- Record photos, measurements, crack pattern and wall movement.
- Explain whether the goal is repair, stabilization, lifting or water control.
- Use the dataset as a screening tool, not a final bid sheet.
Contractor Lead Qualification Checklist
Use these fields to separate cosmetic crack enquiries from structural, water, piering, wall-stabilisation and crawl-space projects.
- Foundation type: slab, basement, crawl space, pier and beam, hillside or stepped foundation.
- Problem pattern: horizontal crack, stair-step crack, vertical crack, settlement, heave, bowing wall, water intrusion or floor sag.
- Access: open basement, tight crawl space, finished interior, exterior excavation, hillside, utilities or landscaping.
- Risk context: expansive clay, drought cycle, frost, drainage failure, flood exposure, seismic region or tree moisture demand.
- Decision stage: homeowner has photos, inspection report, engineering report, sale contingency, insurance question or permit issue.
Methodology
CED built the dataset from public labor, price-level, construction-demand, soil-risk, climate and technical foundation references. Labor context uses BLS May 2025 OEWS and O*NET [2], [3], [4]. State price level uses BEA 2024 Regional Price Parities [22]. Construction demand uses Census and NAHB permit data [5], [6], [7]. Soil and shrink-swell risk use USGS, NRCS and geologic references [8], [9], [10], [11], [12]. Frost risk uses NOAA/NCEI Air-Freezing Index context [25]. Repair boundaries use IRC, HUD, FEMA, ICC-ES and ACI references [13], [14], [15], [16], [17], [18], [19], [20], [21]. 2026 price-pressure checks use FRED/BLS concrete contractor and ready-mix indexes [23], [24].
Data Limitations
Data Freshness and Review Cycle
Last updated: June 2026. Review cycle: annual, or sooner when BLS wage data, Census/NAHB permit data, ICC/IRC provisions, FEMA guidance, ACI repair references, or major construction-cost conditions change. Cost values should be treated as planning ranges because foundation repair pricing depends strongly on site inspection and local contractor scope.
Sources
- [1] BLS Occupational Outlook Handbook, Construction Laborers and Helpers
- [2] BLS May 2025 State Occupational Employment and Wage Statistics
- [3] O*NET, Construction Laborers wages and employment trends
- [4] O*NET Local Wages, Construction Laborers
- [5] U.S. Census Bureau, Building Permits Survey
- [6] U.S. Census Bureau, Permits by State
- [7] NAHB, Building Permits by State and Metro Area
- [8] USGS, Swelling Clays Map of the Conterminous United States
- [9] USGS NGMDB, Swelling Clays Map record
- [10] USDA NRCS, Understanding Soil Risks and Hazards
- [11] Virginia Energy, Expansive Soils
- [12] British Geological Survey, Shrink-swell clay geohazard overview
- [13] ICC Digital Codes, 2024 IRC Chapter 4 Foundations
- [14] HUD User, Residential Structural Design Guide
- [15] FEMA P-2181, Hurricane and Flood Mitigation Handbook foundation fact sheets
- [16] FEMA P-50-1, Seismic Retrofit Guidelines for One- and Two-Family Dwellings
- [17] FEMA P-2091, Practical Guide to Soil-Structure Interaction
- [18] ICC-ES AC358, Acceptance Criteria for Helical Pile Systems and Devices
- [19] ACI 562 Repair Code Portal
- [20] ACI CODE-562-25, Assessment, Repair and Rehabilitation of Existing Concrete Structures
- [21] FEMA P-1024, Earthquake Strengthening of Cripple Walls in Wood-Frame Dwellings
- [22] BEA, 2024 Regional Price Parities by State and Metro Area
- [23] FRED/BLS, Producer Price Index: Concrete Contractors, Nonresidential Building Work
- [24] FRED/BLS, Producer Price Index: Ready-Mix Concrete
- [25] NOAA/NCEI, Frost Protected Shallow Foundations and Air-Freezing Index